1. 개요
우분투 서버에서 Premethus, Grafana를 설치하는 문서
Prometheus는 각종 모니터링에 사용된다. 예를 들어 Redis용 exporter를 사용하면 Prometheus/Grafana 기반으로 Redis 모니터링도 가능하다.
2. Prometheus 설치
2.1. 계정 생성
$ sudo useradd --no-create-home --shell /usr/sbin/nologin prometheus
2.2. Prometheus 설치
$ sudo apt-get install -y prometheus prometheus-node-exporter prometheus-pushgateway prometheus-alertmanager
Reading package lists... Done
Building dependency tree
Reading state information... Done
The following additional packages will be installed:
  daemon javascript-common libjs-angularjs libjs-bootstrap libjs-d3 libjs-eonasdan-bootstrap-datetimepicker libjs-jquery libjs-jquery-hotkeys libjs-moment
  libjs-mustache libjs-rickshaw
Suggested packages:
  apache2 | lighttpd | httpd
The following NEW packages will be installed:
  daemon javascript-common libjs-angularjs libjs-bootstrap libjs-d3 libjs-eonasdan-bootstrap-datetimepicker libjs-jquery libjs-jquery-hotkeys libjs-moment
  libjs-mustache libjs-rickshaw prometheus prometheus-alertmanager prometheus-node-exporter prometheus-pushgateway
0 upgraded, 15 newly installed, 0 to remove and 57 not upgraded.
Need to get 16.4 MB of archives.
After this operation, 68.0 MB of additional disk space will be used.
Get:1 http://ap-northeast-1.ec2.archive.ubuntu.com/ubuntu bionic/main amd64 libjs-jquery all 3.2.1-1 [152 kB]
Get:2 http://ap-northeast-1.ec2.archive.ubuntu.com/ubuntu bionic/universe amd64 libjs-jquery-hotkeys all 0~20130707+git2d51e3a9+dfsg-2ubuntu1 [11.4 kB]
Get:3 http://ap-northeast-1.ec2.archive.ubuntu.com/ubuntu bionic/universe amd64 daemon amd64 0.6.4-1build1 [99.5 kB]
Get:4 http://ap-northeast-1.ec2.archive.ubuntu.com/ubuntu bionic/main amd64 javascript-common all 11 [6066 B]
Get:5 http://ap-northeast-1.ec2.archive.ubuntu.com/ubuntu bionic/main amd64 libjs-angularjs all 1.5.10-1 [506 kB]
Get:6 http://ap-northeast-1.ec2.archive.ubuntu.com/ubuntu bionic/universe amd64 libjs-bootstrap all 3.3.7+dfsg-2 [228 kB]
Get:7 http://ap-northeast-1.ec2.archive.ubuntu.com/ubuntu bionic/universe amd64 libjs-d3 all 3.5.17-2 [131 kB]
Get:8 http://ap-northeast-1.ec2.archive.ubuntu.com/ubuntu bionic/universe amd64 libjs-moment all 2.20.1+ds-1 [124 kB]
Get:9 http://ap-northeast-1.ec2.archive.ubuntu.com/ubuntu bionic/universe amd64 libjs-rickshaw all 1.5.1.dfsg-2 [648 kB]
Get:10 http://ap-northeast-1.ec2.archive.ubuntu.com/ubuntu bionic/universe amd64 libjs-eonasdan-bootstrap-datetimepicker all 4.17.47-3 [27.5 kB]
Get:11 http://ap-northeast-1.ec2.archive.ubuntu.com/ubuntu bionic/universe amd64 libjs-mustache all 2.3.0-2 [19.8 kB]
Get:12 http://ap-northeast-1.ec2.archive.ubuntu.com/ubuntu bionic/universe amd64 prometheus amd64 2.1.0+ds-1 [7147 kB]
Get:13 http://ap-northeast-1.ec2.archive.ubuntu.com/ubuntu bionic/universe amd64 prometheus-alertmanager amd64 0.6.2+ds-3 [2592 kB]
Get:14 http://ap-northeast-1.ec2.archive.ubuntu.com/ubuntu bionic/universe amd64 prometheus-node-exporter amd64 0.15.2+ds-1 [2518 kB]
Get:15 http://ap-northeast-1.ec2.archive.ubuntu.com/ubuntu bionic/universe amd64 prometheus-pushgateway amd64 0.4.0+ds-1ubuntu1 [2173 kB]
Fetched 16.4 MB in 8s (2182 kB/s)
Preconfiguring packages ...
2.3. 설치 및 기동 확인
$ ps -ef | grep prometheus
prometh+ 30204     1  0 15:08 ?        00:00:00 /usr/bin/prometheus-node-exporter --collector.diskstats.ignored-devices=^(ram|loop|fd|(h|s|v|xv)d[a-z]|nvmed+nd+p)d+$ --collector.filesystem.ignored-mount-points=^/(sys|proc|dev|run)($|/) --collector.netdev.ignored-devices=^lo$ --collector.textfile.directory=/var/lib/prometheus/node-exporter
prometh+ 30435     1  0 15:08 ?        00:00:00 /usr/bin/prometheus-pushgateway -persistence.file=/var/lib/prometheus/pushgateway.data
prometh+ 30512     1  0 15:08 ?        00:00:00 /usr/bin/prometheus-alertmanager
prometh+ 30643     1  0 15:08 ?        00:00:00 /usr/bin/prometheus
ubuntu   30744 29893  0 15:10 pts/1    00:00:00 grep --color=auto prometheus
3. Grafana 설치
3.1. Repository 추가
$ sudo add-apt-repository "deb https://packages.grafana.com/oss/deb stable main"
Hit:1 http://ap-northeast-1.ec2.archive.ubuntu.com/ubuntu bionic InRelease
Get:2 http://ap-northeast-1.ec2.archive.ubuntu.com/ubuntu bionic-updates InRelease [88.7 kB]
Get:3 http://ap-northeast-1.ec2.archive.ubuntu.com/ubuntu bionic-backports InRelease [74.6 kB]
Get:4 http://security.ubuntu.com/ubuntu bionic-security InRelease [88.7 kB]
Get:5 https://packages.grafana.com/oss/deb stable InRelease [12.1 kB]
Get:6 http://ap-northeast-1.ec2.archive.ubuntu.com/ubuntu bionic-updates/universe amd64 Packages [1025 kB]
Err:5 https://packages.grafana.com/oss/deb stable InRelease
  The following signatures couldn't be verified because the public key is not available: NO_PUBKEY 8C8C34C524098CB6
Reading package lists... Done
W: GPG error: https://packages.grafana.com/oss/deb stable InRelease: The following signatures couldn't be verified because the public key is not available: NO_PUBKEY 8C8C34C524098CB6
E: The repository 'https://packages.grafana.com/oss/deb stable InRelease' is not signed.
N: Updating from such a repository can't be done securely, and is therefore disabled by default.
N: See apt-secure(8) manpage for repository creation and user configuration details.
만약 위와 같이 NO_PUBKEY 에러가 발생하면 The following signatures couldn't be verified because the public key is not 문서를 참고하여 해결한다.
이렇게 되어야 정상이다.
$ sudo add-apt-repository "deb https://packages.grafana.com/oss/deb stable main"
Hit:1 http://ap-northeast-1.ec2.archive.ubuntu.com/ubuntu bionic InRelease
Hit:2 http://ap-northeast-1.ec2.archive.ubuntu.com/ubuntu bionic-updates InRelease
Hit:3 http://ap-northeast-1.ec2.archive.ubuntu.com/ubuntu bionic-backports InRelease
Hit:4 http://security.ubuntu.com/ubuntu bionic-security InRelease
Get:5 https://packages.grafana.com/oss/deb stable InRelease [12.1 kB]
Get:6 https://packages.grafana.com/oss/deb stable/main amd64 Packages [13.8 kB]
Fetched 13.8 kB in 1s (9670 B/s)
Reading package lists... Done
3.2. 키 다운로드
$ curl https://packages.grafana.com/gpg.key | sudo apt-key add -
  % Total    % Received % Xferd  Average Speed   Time    Time     Time  Current
                                 Dload  Upload   Total   Spent    Left  Speed
100  1694  100  1694    0     0   3046      0 --:--:-- --:--:-- --:--:--  3046
OK
3.3. apt 설치
$ sudo apt-get install grafana
Reading package lists... Done
Building dependency tree
Reading state information... Done
The following additional packages will be installed:
  fontconfig-config fonts-dejavu-core libfontconfig1
The following NEW packages will be installed:
  fontconfig-config fonts-dejavu-core grafana libfontconfig1
0 upgraded, 4 newly installed, 0 to remove and 57 not upgraded.
Need to get 61.1 MB of archives.
After this operation, 176 MB of additional disk space will be used.
Do you want to continue? [Y/n] y
3.4. Grafana 시작
$ sudo systemctl daemon-reload
$ sudo systemctl start grafana-server
$ sudo systemctl enable grafana-server
Synchronizing state of grafana-server.service with SysV service script with /lib/systemd/systemd-sysv-install.
Executing: /lib/systemd/systemd-sysv-install enable grafana-server
Created symlink /etc/systemd/system/multi-user.target.wants/grafana-server.service → /usr/lib/systemd/system/grafana-server.service.
3.5. 기동 확인
$ ps -ef | grep grafana
grafana  32146     1  3 15:27 ?        00:00:00 /usr/sbin/grafana-server --config=/etc/grafana/grafana.ini --pidfile=/var/run/grafana/grafana-server.pid --packaging=deb cfg:default.paths.logs=/var/log/grafana cfg:default.paths.data=/var/lib/grafana cfg:default.paths.plugins=/var/lib/grafana/plugins cfg:default.paths.provisioning=/etc/grafana/provisioning
ubuntu   32263 29893  0 15:27 pts/1    00:00:00 grep --color=auto grafana
3.6. Grafana 설정 파일
설정 파일은 /etc/grafana/grafana.ini 이다. 설정 변경 시에는 systemctl restart grafana-server 를 실행한다.
4. Grafana 접속
Grafana 기본 포트는 3000번이다. 접속이 안되면 방화벽을 확인한다.
기본 접속 정보는 admin/admin인데 처음 접속하면 패스워드를 바꾸라고 나온다. 이래저래 접속하면 이런 화면까지 진입한다.
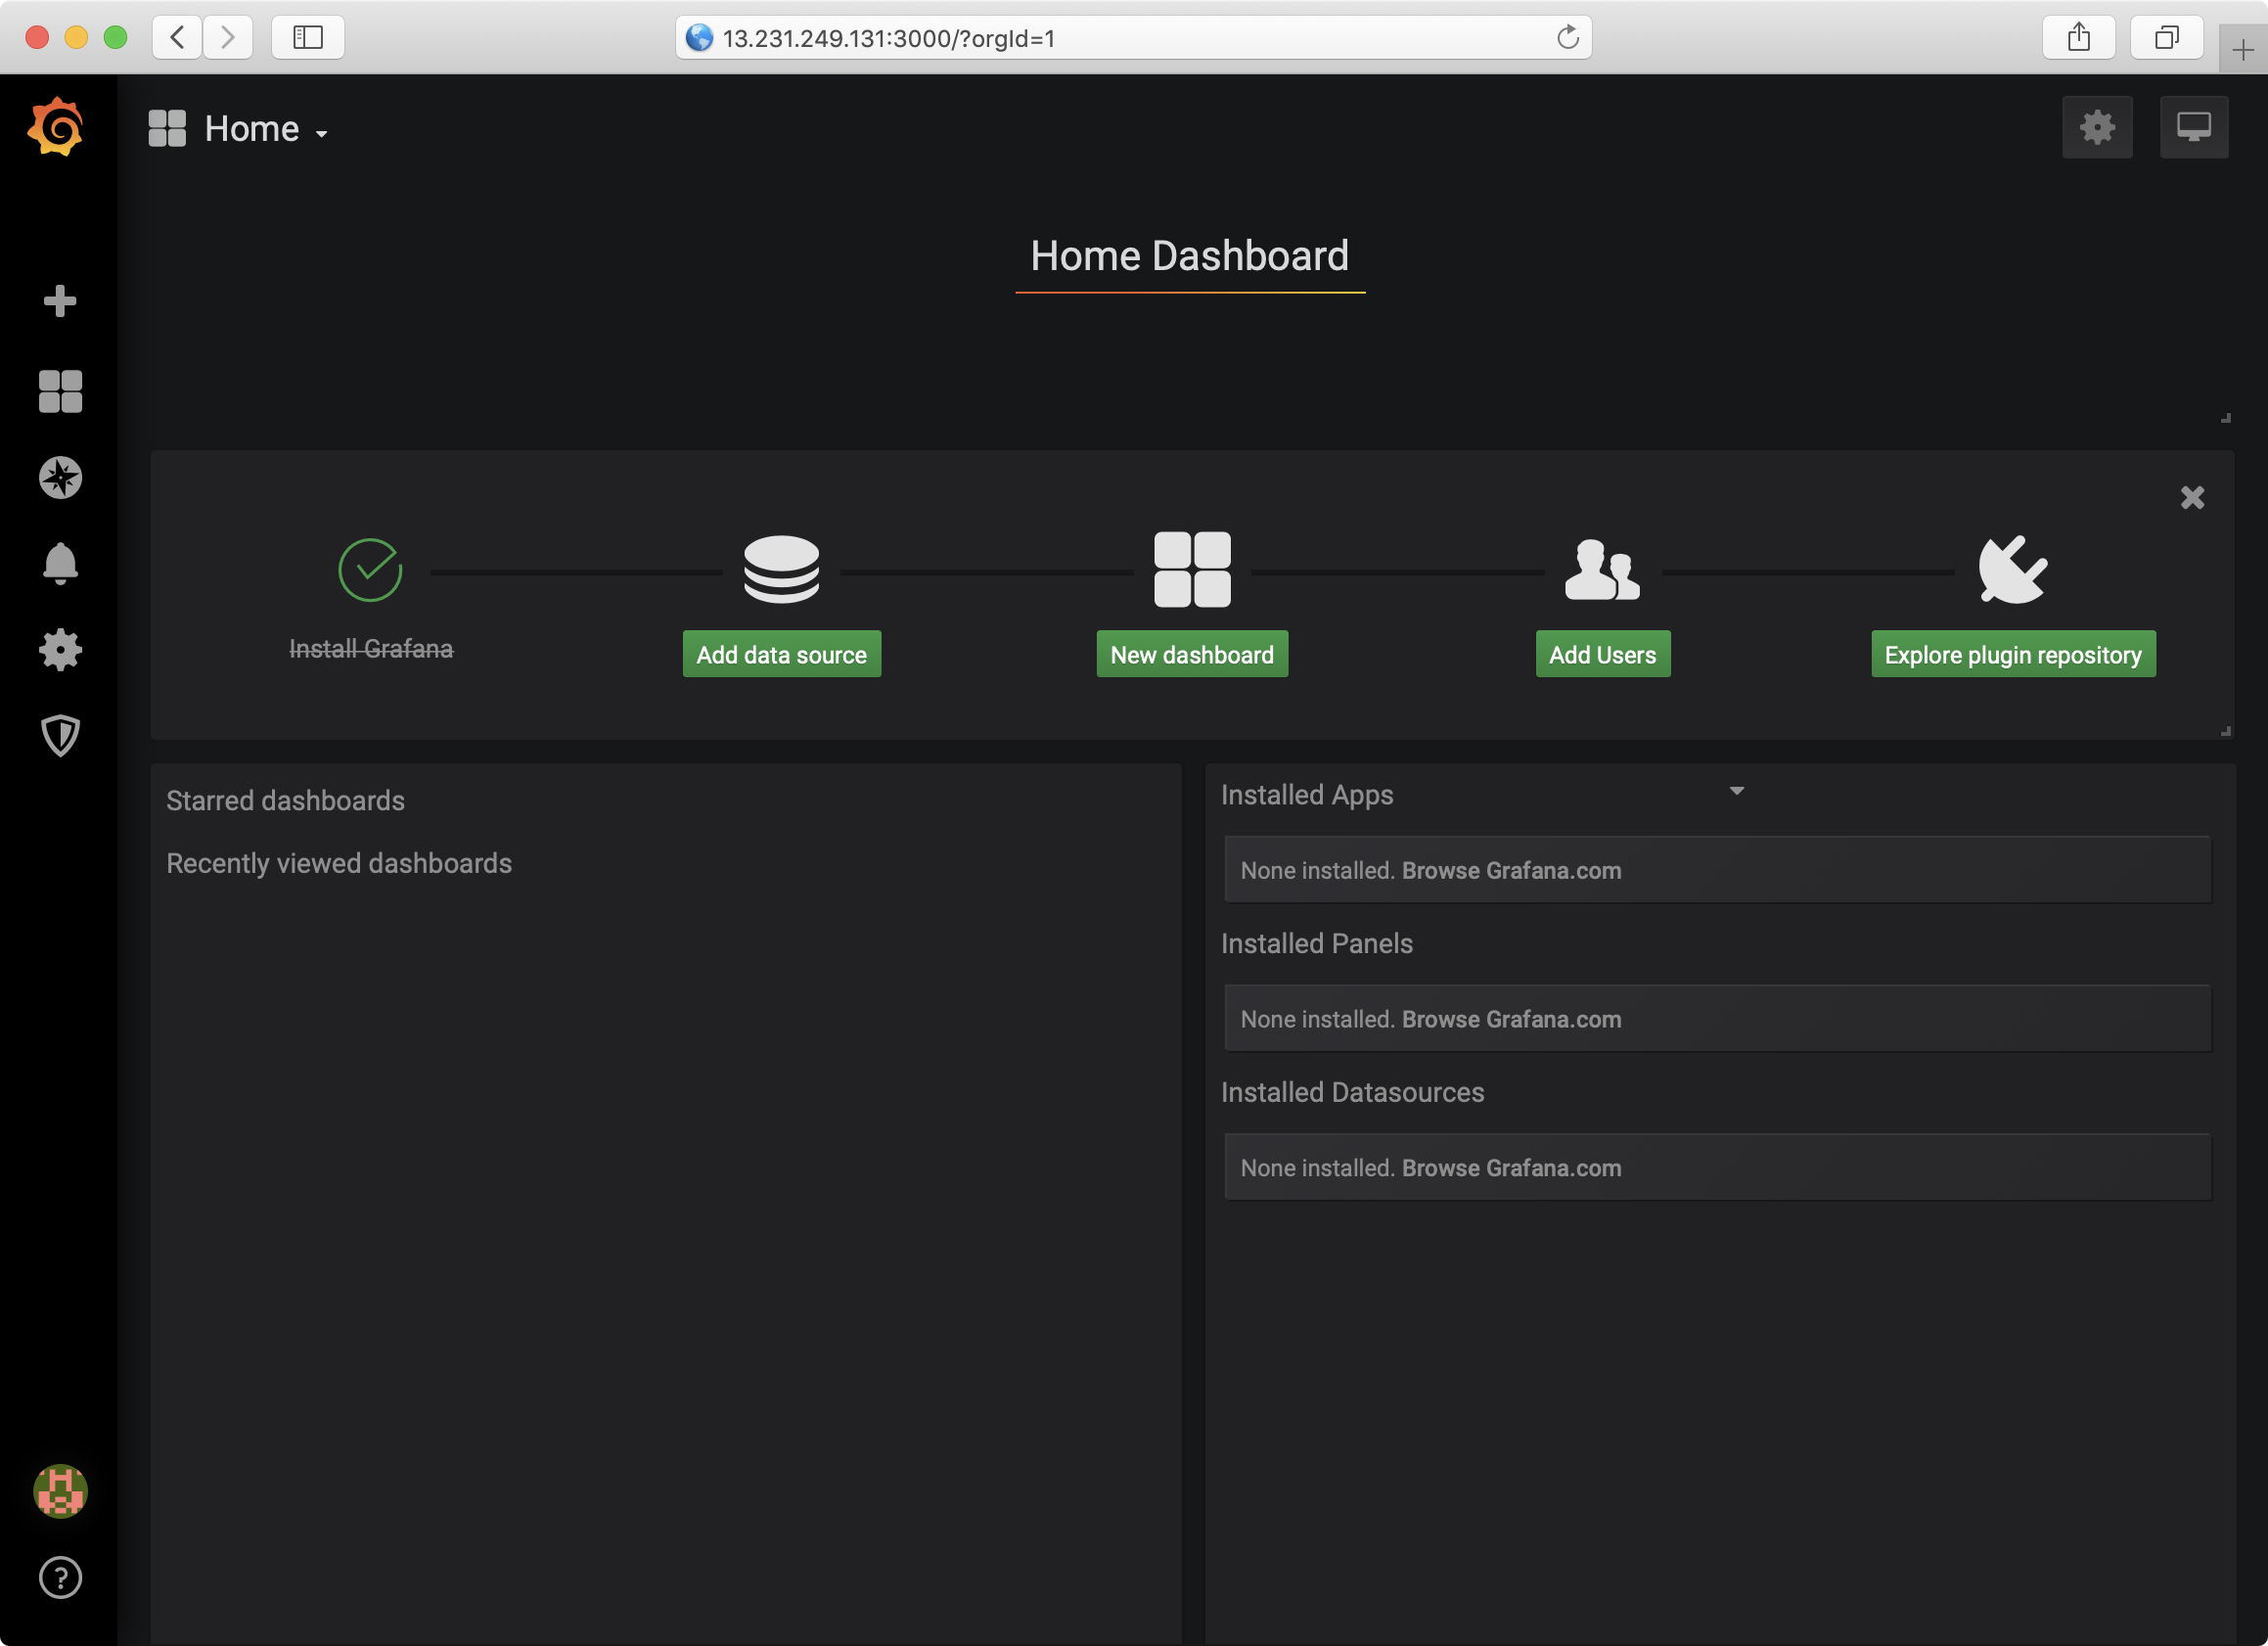
일단 지금은 Grafana가 설치된 상태이다. 이제 Prometheus와 연동하는 작업을 하기 위해 또 많은 작업을 진행하겠다.
5. Node Exporter 설치
원래 sudo apt install prometheus-node-exporter 로 설치해야 하는데 우리는 맨 첫 단계에서 다 설치했다.
그리고 /etc/prometheus/prometheus.yml 파일에 수집 대상 서버 정보를 추가한다. 우리는 일단 localhost를 추가할 것이다.
scrape_configs:
  - job_name: 'node'
    # If prometheus-node-exporter is installed, grab stats about the local
    # machine by default.
    static_configs:
      - targets: ['localhost:9100']
설정 파일 반영 후에는 Prometheus를 재시작한다.
$ sudo systemctl reload prometheus.service
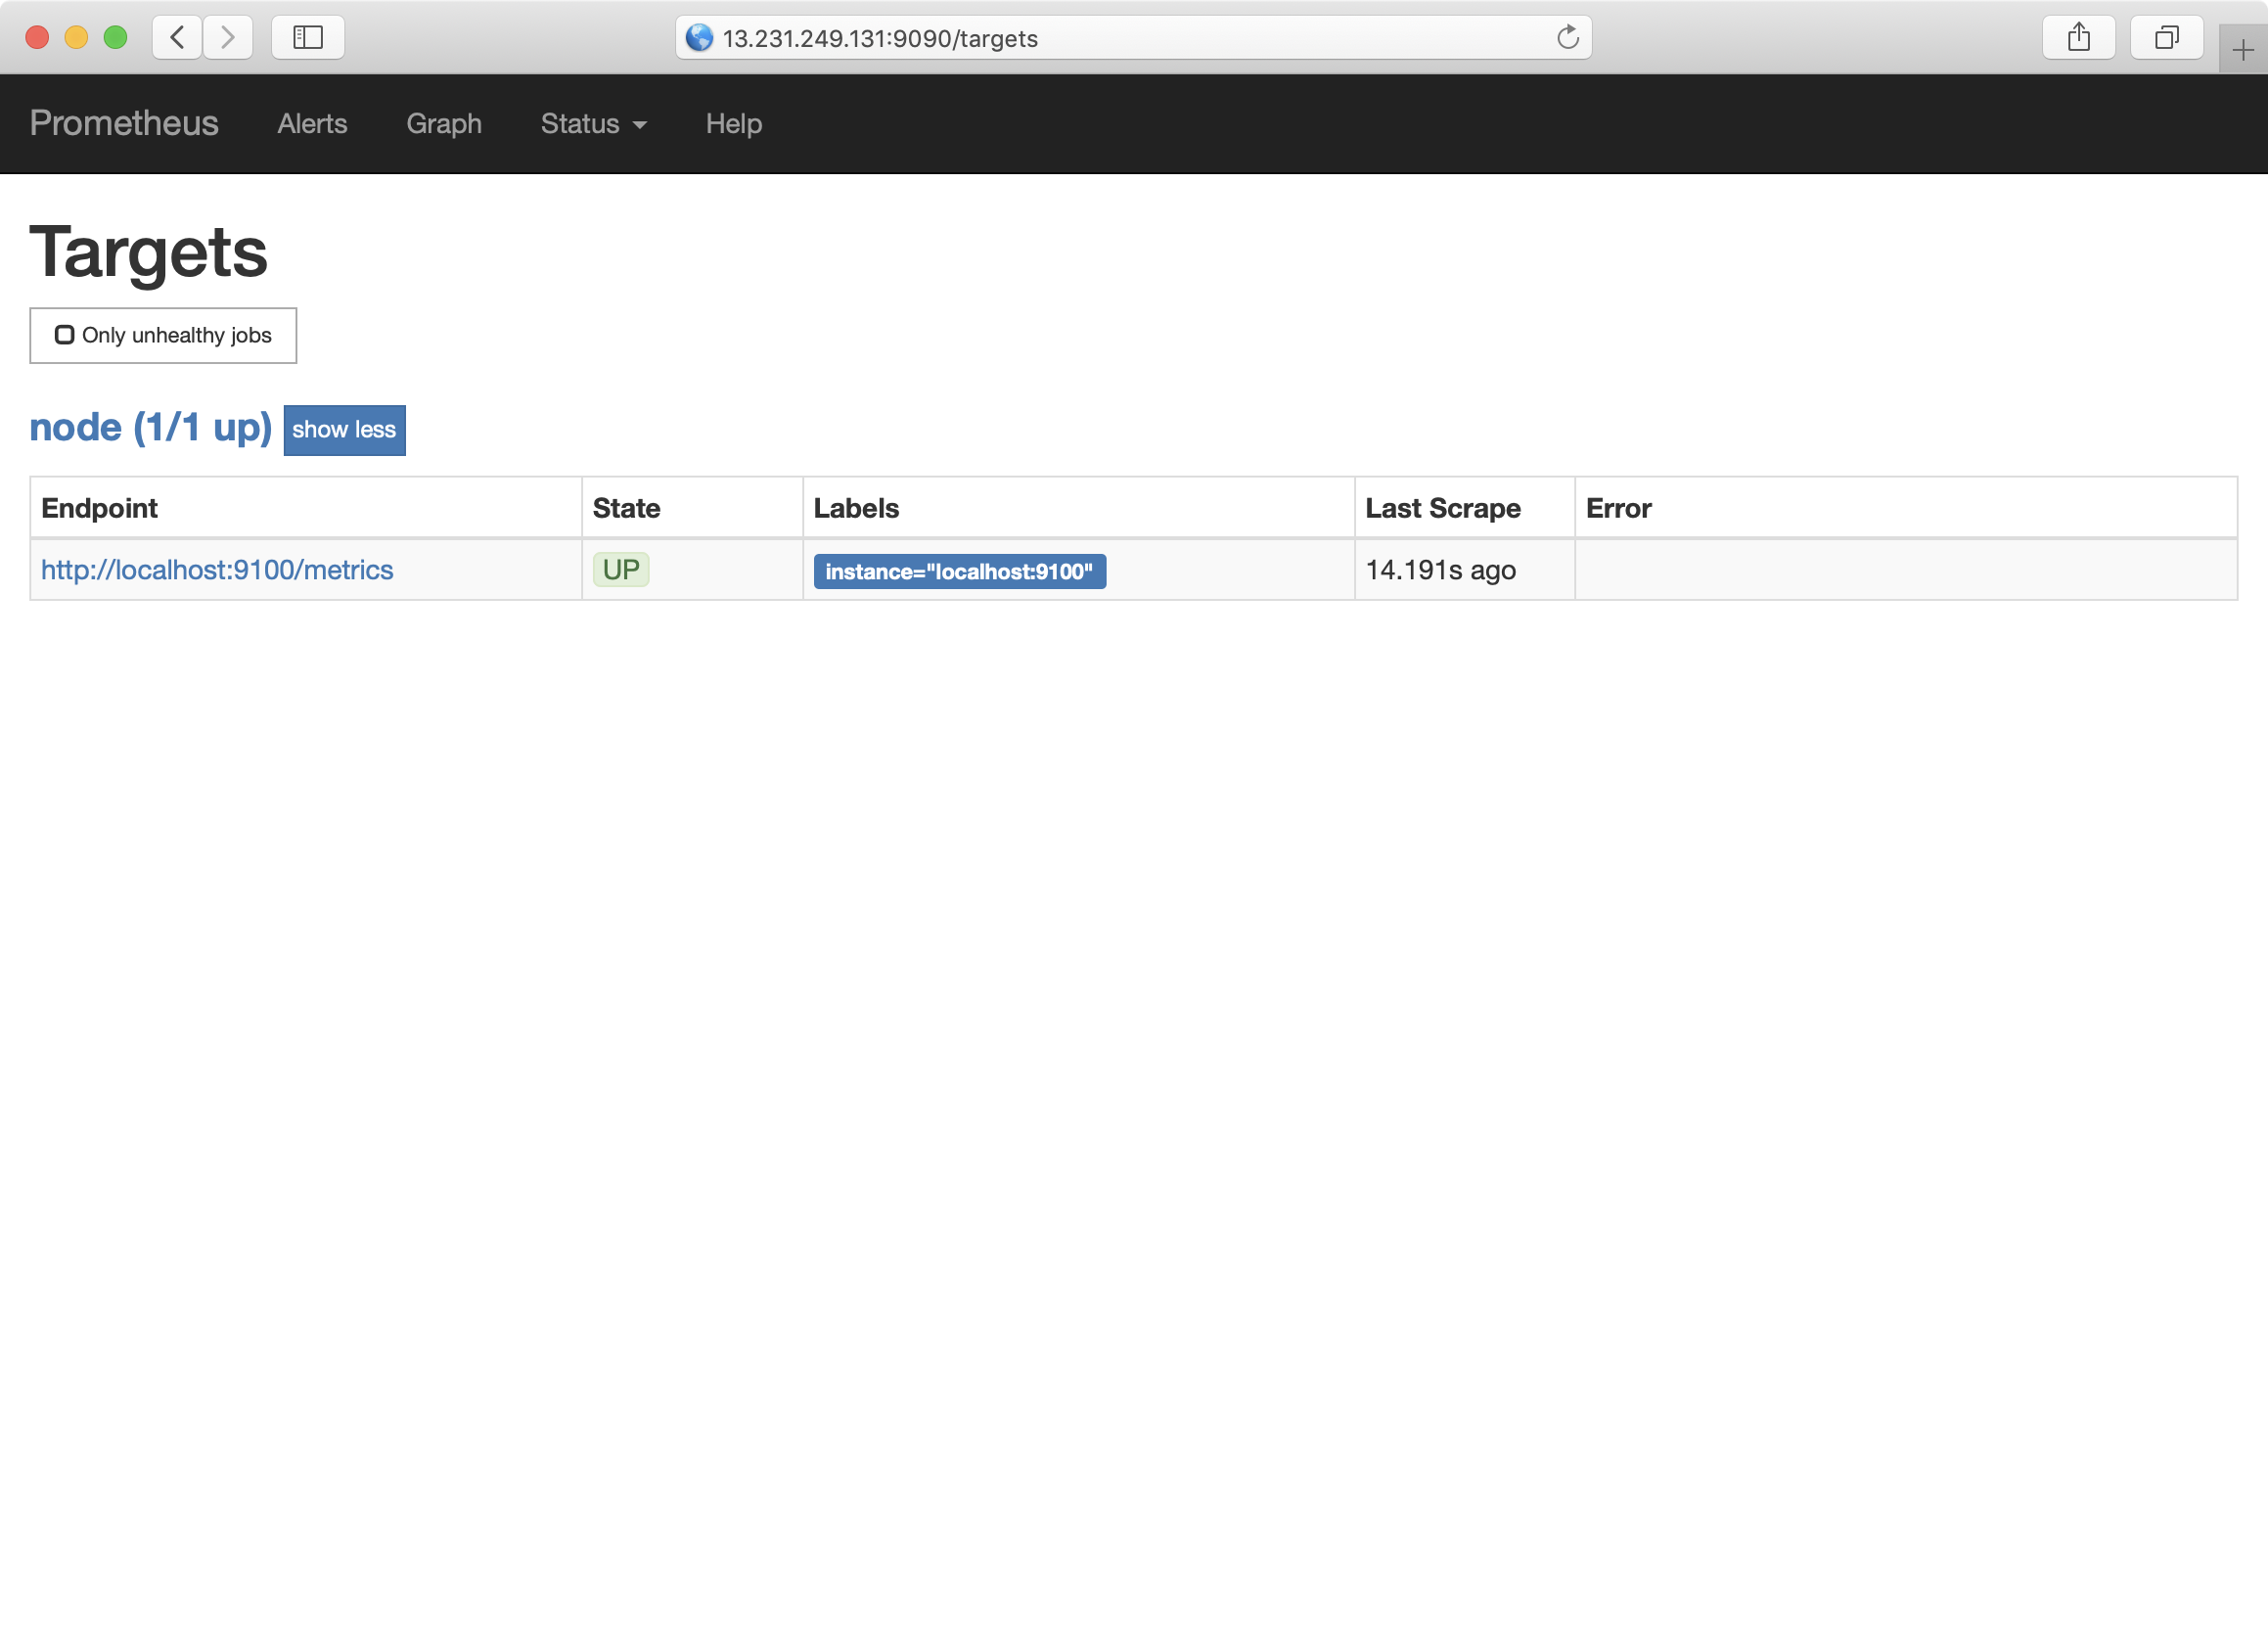
6. Prometheus 접속
Prometheus 포트는 9090이다.
/targets로 접속하면 앞단계에서 설정한 모니터링 대상을 볼 수 있다.
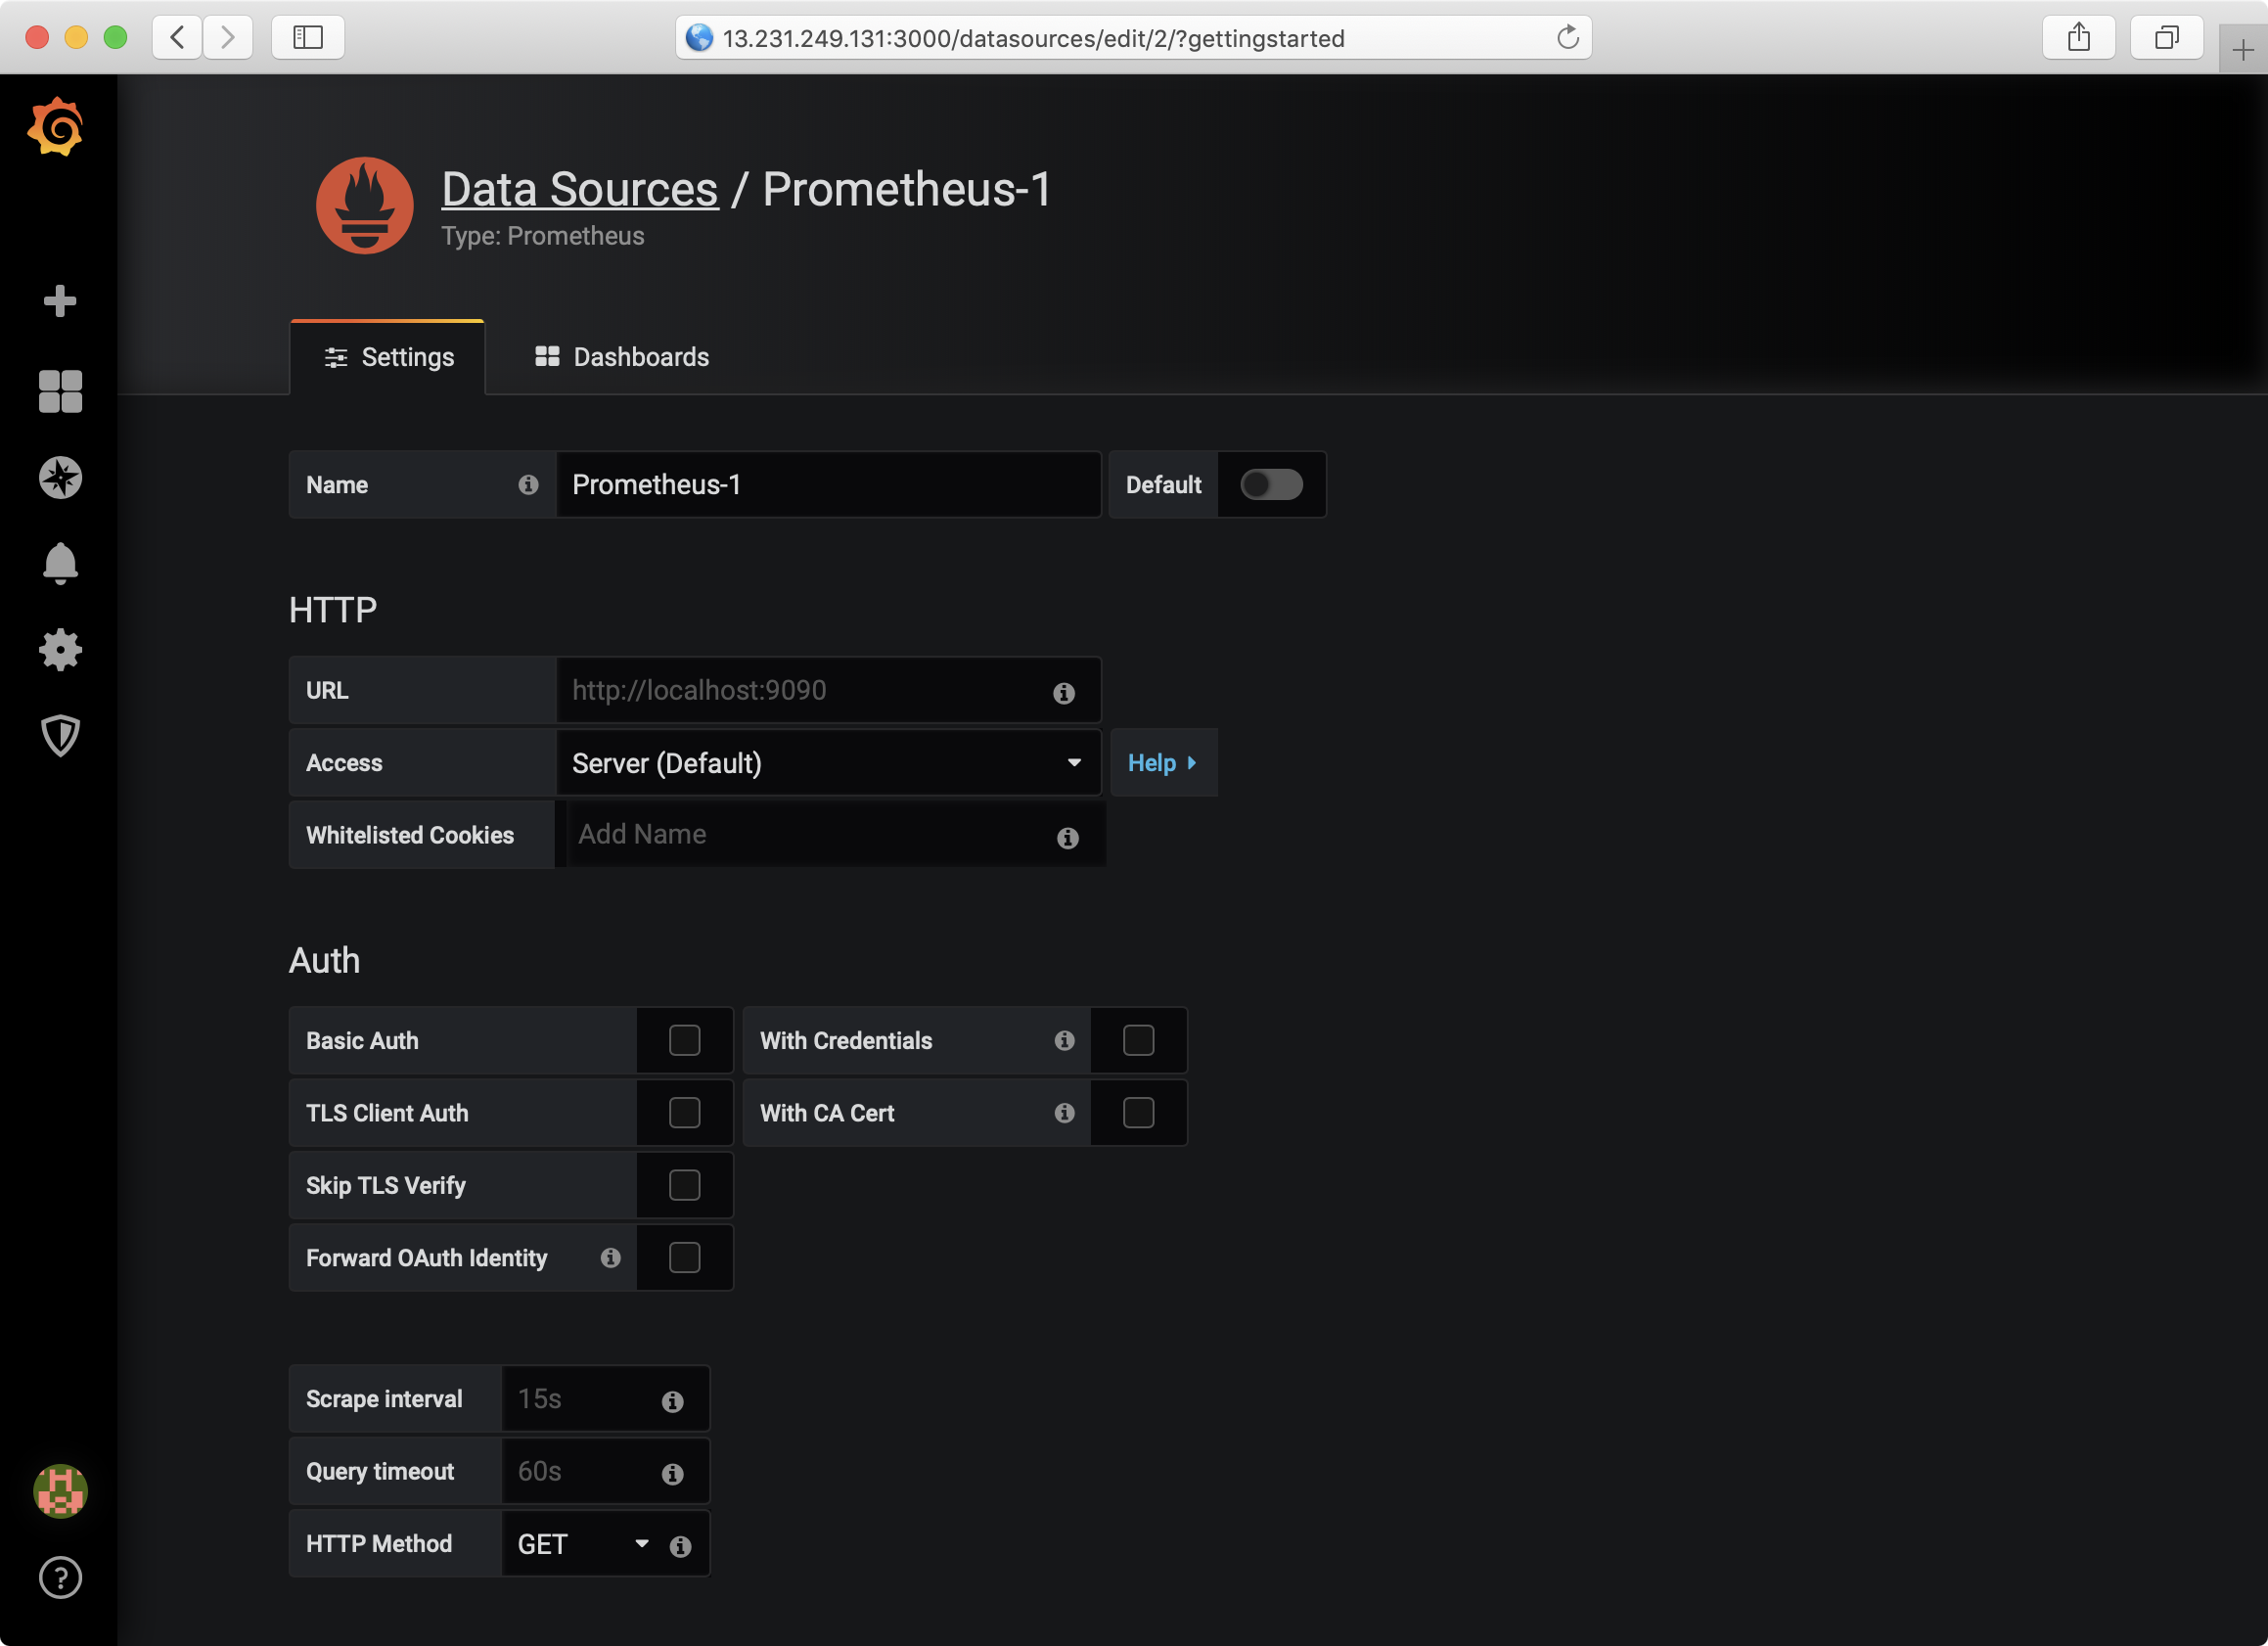
7. Grafana에서 Prometheus 데이터 보기
8. Prometheus 데이터 삭제
8.1. Service Argument 수정
/etc/default/prometheus 파일을 열고 ARGS에 다음을 추가한다.
ARGS="--web.enable-admin-api"
참고로 위 설정을 한 이유는 curl로 API를 호출하기 위함이다. 기본적으로는 Admin API를 사용할 수 없고 이런 에러가 난다.
{"status":"error","errorType":"unavailable","error":"Admin APIs disabled"}
8.2. 삭제
172.31.11.49:9100이라는 특정 타겟의 데이터를 삭제하는 방법이다.
$ curl -X POST -g 'http://localhost:9090/api/v1/admin/tsdb/delete_series?match[]={instance="172.31.11.49:9100"}'